Follow a torque request from the code to the contact patch. Compare response, inspect the chassis and explore the maths behind what you feel.
THE HARDWARE HAS MOVED ON
More mechanical grip. The software must catch up.
Modern performance tyres can provide significantly more dry grip than the tyres available at launch. That extra mechanical capability is central to Senica’s approach: revisiting torque thresholds and response to suit what the car can now transmit to the road.
01 / THE ORIGINAL PACKAGE
Calibrated for its time.
The Challenge Stradale’s original Pirelli P Zero Corsa was cutting-edge in 2003. Ferrari developed the car around the tyres and chassis of that period, balancing traction, response, driveability and durability. The factory calibration belongs to that complete launch package.
02 / THE OPPORTUNITY TODAY
A higher physical ceiling.
Advances in compounds and construction can give suitable modern tyres a higher effective coefficient of grip, μ, under comparable dry conditions. With greater available grip, more torque can reach the road before tyre slip becomes the limiting factor.
03 / THE SENICA CALIBRATION
Make use of that headroom.
As our CS guide explains, we can raise appropriate digital torque thresholds and reduce torque smoothing to exploit that extra grip. The objective is stronger, earlier torque delivery within the traction available from the car’s actual setup.
New tyres do not rewrite the ECU.
Fit higher-grip tyres and the physical limit changes, but the original ECU programming does not automatically raise its stored torque caps or accelerate its programmed torque ramp. It has no automatic knowledge of your tyre, suspension or alignment upgrades that rewrites those calibration limits.
The handling benefits arrive with the hardware. Access to torque delivery held back by the original programmed limits requires recalibration. Senica’s remap addresses that gap. Traction-control reactions to wheel slip are separate from changing the underlying torque maps.
DEVELOPING THE WHOLE CAR
Chassis improvements strengthen the case.
A well-matched suspension, alignment and tyre package can make a substantial difference to handling and usable grip. None of these changes automatically raises the ECU’s programmed thresholds.
Lower centre of gravity
Correctly lowered suspension can reduce lateral load transfer for the same cornering acceleration. Geometry and suspension travel must remain appropriate.
Matched spring rates
Appropriate spring rates and damping can control body roll and help maintain tyre geometry. Less roll alone does not guarantee more grip on every surface.
Dialled-in negative camber
Suitable negative camber can keep the loaded outside tyre working more effectively in a corner. The setting balances cornering contact against straight-line traction and wear.
Suitable wider tyres
A properly matched wider fitment can improve dry cornering capability and heat management. Width, compound, rim support, pressure and temperature work together.
THE RESPONSE EXPLORER
More torque. Earlier in the moment.
ILLUSTRATIVE MODEL
Start with a Ferrari 360 at 275 lb-ft, then compare Senica’s Stage 2 example at 315 lb-ft with sports catalysts, a free-flow exhaust and our remap. That is around 14.5% more peak torque. How quickly it arrives, and how much grip can transmit it, determine the acceleration you feel.
Torque inputs are supplied by Senica: 275 lb-ft stock and an achievable 315 lb-ft Stage 2 example for the stated hardware. Response times, gearing, mass and road conditions remain illustrative. This is a peak-torque operating-point model, not a measured dyno curve or acceleration test. The Stage 2 gain includes hardware and calibration changes; it is not attributed solely to removing a cap.
A / STOCK FERRARI 360
275 lb-ft
≈ 372.85 N·m
The full stock peak-torque reference. No arbitrary 75% reduction is applied to this figure.
B / SENICA STAGE 2
315 lb-ft
≈ 427.08 N·m
Sports catalysts, a free-flow exhaust and Senica calibration. Results depend on the individual car and configuration.
See why hardware alone leaves a software limit. For an illustration, set B’s digital torque cap to 80%, then raise tyre–road grip, μ. The grip ceiling rises; B’s programmed torque target stays fixed.
Next, raise the digital cap and shorten the response time to explore using the extra headroom. A and B always share the selected road conditions. The 80% setting is a teaching example, not a claimed factory cap. Revisit the tyre and chassis context.
Torque following your request
Engine torque · N·m
A / stock
B / exploration
Grip ceiling*
*Grip ceiling is road-force capacity converted to equivalent engine torque, including the selected load-transfer assumption. It is separate from the ECU cap.
At the selected instant
A274.7 N·mengine torque
B421.6 N·mengine torque
The acceleration you can use
At 0.50 s
A
—
B
—
— usable acceleration at this instant, B compared with A.
Same mass, gearing and road conditions. Only force within the grip envelope counts.
B has the stated Stage 2 torque potential and the shorter illustrative response time. Grip determines how much of that extra demand becomes acceleration.
Permitted torque target · selected example
A 372.85 N·m / B 427.08 N·m
Stock and Stage 2 have different torque inputs. The digital-cap slider can restrict B within its selected input; it does not generate additional engine capability.
Speed gained · first second
A — / B —
Δv = ∫Fusabledt / m. An idealised change in speed over one second, not a standing-start test.
Time to 90% of each torque rise
A 1.04 s / B 0.28 s
Measured towards each capped target, not 90% of full engine torque.
Usable driving impulse · first second
— B compared with A
Area under road force × time. Same mass means the same proportional change in speed gained in this idealised model.
B at 0.50 s · hollow: demanded · filled: usable
WHERE RUBBER MEETS THE ROAD
Grip is a shared budget.
Acceleration and cornering ask the same contact patches for force. Move the cornering control and watch the headroom shrink. Suitable modern tyres can expand that grip envelope. Increase μ here and the circle expands, while the engine’s programmed torque cap stays exactly where it was. A remap can then change the permitted delivery to use the additional headroom. With load transfer enabled, rearward loading also changes this circle as acceleration builds.
B / demanded driving force—
Driving grip at B’s current axle load—
B / usable driving force—
The demanded force is inside the assumed grip envelope.
At the boundary, this demonstration caps usable force ideally. A real tyre develops force through slip; exceeding its capability can mean wheelspin or intervention. This is not a traction-control simulation.
THE FORCES YOU FEEL
Follow the force through the chassis.
Two identical cars. The same instant. The Ferrari 360 illustration carries each response through to driving force, acceleration and axle loading. Play the comparison to see how the different torque inputs and response times affect usable force.
Shared time 0.50 s
A / Stock 360 reference
— N·m
Rear —Front —
Driving force—
Acceleration—
Load shifted rearward—
Ferrari 360 illustration · assumed L = 2.60 m and h = 0.45 m. Whole-axle forces; identical arrow scales for A and B.
B / Stage 2 example
— N·m
Rear —Front —
Driving force—
Acceleration—
Load shifted rearward—
Ferrari 360 illustration · assumed L = 2.60 m and h = 0.45 m. Whole-axle forces; identical arrow scales for A and B.
Move the time slider to compare the loads at the same instant.
01 / ACCELERATE
a = Fdrive / m
Usable tyre force accelerates the car. Torque that exceeds grip cannot be counted as extra acceleration.
02 / TRANSFER LOAD
ΔFz = m a h / L
The centre of gravity sits above the road. Under acceleration, the rear axle carries more load and the front carries less.
The two loads still add up to mg. Earlier torque can build this load transfer sooner; it does not change the car’s mass.
The load-transfer calculation assumes pitch equilibrium at every instant. Spring compression, damper motion and body pitch are not simulated. The Ferrari 360 wireframe provides visual context; the wheelbase and centre-of-gravity values are teaching assumptions, not measurements taken from the illustration.
During a shift, the TCU requests a target engine torque. Senica’s code patches help the engine match that request sooner, reducing the time the gearbox controller needs to wait. This improves coordination and can support faster shifts.
01TCU requests
The gearbox controller asks the engine for the torque needed for the shift phase.
02Engine matches
The patched engine control follows that target more quickly, including a requested torque reduction.
03Shift proceeds
The TCU’s torque-matching condition can be satisfied sooner. Clutch, actuator and mechanical timing still affect the complete shift.
An illustrative torque-reduction request
Engine torque · N·m
A / reference response
B / selected response
TCU target
Uses the explorer’s shared time and selected B response constant. The 250 → 100 N·m request and response times are illustrative, not recorded shift data.
A / engine torque—Approaching the request
B / engine torque—Approaching the request
TCU target100 N·mHeld constant in this example
The display marks a response as “inside the example band” once it is within 15 N·m of the request: 10% of this 150 N·m change. This teaching threshold is not a Ferrari TCU acceptance criterion. Reaching it sooner illustrates less torque-matching delay; it does not establish a total gear-change time. Actual shift strategy also controls torque restoration.
These naturally aspirated engines respond to careful development. Senica’s reported power ranges set realistic expectations: the feel also comes from torque delivery, response and coordination with the gearbox.
Manufacturer ratings and Senica’s reported workshop figures
Ferrari
Published rating
Senica-reported standard car
Senica remap + free-flow system
360 Modena
400 CV / PS
Typically around 380 hp
Approximately 415–425 hp
Challenge Stradale
425 CV / PS
Approximately 420–425 hp
Approximately 435–440 hp
Workshop ranges are supplied by Senica and are indicative, not guaranteed outputs or certified before-and-after test results. Manufacturer CV/PS ratings use metric horsepower; the workshop figures are retained as reported in hp. Confirm crank-versus-wheel measurement, units and dyno correction method before comparing figures. No wheel-power conversion or assumed driveline loss has been applied to this table.
Closely related. Individually developed.
The upgraded Modena range approaches the reported output of a standard Challenge Stradale. Senica attributes part of the CS’s advantage to its more closely matched engine build and polished heads. Calibration is developed around the hardware and condition of each car.
Torque and power meet at engine speed.
PkW = TN·m × rpm / 9549.3
Peak torque and peak power normally occur at different engine speeds. The 315 lb-ft Stage 2 torque input is not held constant to the rev limit to invent a horsepower figure. The explorer shows a representative torque response, not a complete engine curve.
The Challenge Stradale guide describes the time-dependent smoothing behind the feeling. This simplified chain makes that idea visible.
01RequestPedal position, engine speed and driving mode
02ArbitrateChoose a permitted torque target
03RespondMove towards that target over time
04TransmitGearing turns torque into road force
05Find gripThe contact patches bound usable force
01 / HOW MUCH
The cap sets the destination.
In a torque-based controller, pedal position is an input to a request. Engine speed, mode and other demands matter too. The ECU coordinates that request with its permitted limits.
Ttarget = min(Trequest, Tcap)
The stock input is 372.85 N·m and the Stage 2 input is 427.08 N·m. With each allowed to reach its full target, the increase is 14.5%. At the same gearing, mass and sufficient grip, usable steady acceleration rises by the same proportion. Apply an illustrative 80% cap to Stage 2 and only 341.67 N·m is permitted: more engine potential is of little use if the controller withholds it.
This min-function represents one limit. Real arbitration includes multiple operating and protection constraints.
02 / HOW SOON
The time constant shapes the journey.
A first-order filter moves a fraction of the remaining distance towards the target at each update. A shorter time constant means a larger fraction, and a quicker response.
Tnext = Tnow + α(Ttarget − Tnow) α = 1 − e−Δt/τ
Here τ is the time constant and Δt is the update interval. After one τ, 63.2% of the requested change is complete. At 2.303τ, it is 90% complete.
This is an educational first-order approximation, not a disclosure of Senica’s ECU code or its update rate.
03 / HOW IT REACHES YOU
Torque becomes tractive force.
The selected gear and final drive multiply engine torque. Driveline losses reduce it; tyre radius converts wheel torque into a force at the road.
Fdemand = Tengine × G × η / r
G is the combined gear ratio, η is driveline efficiency and r is the effective rolling radius. More force gives more acceleration if grip can transmit it: a = Fnet / m.
The explorer holds gearing fixed. It omits gear changes, aerodynamic drag, rolling resistance and rotational inertia.
04 / HOW MUCH WILL GRIP
The road has the final say.
A circular approximation bounds the combined driving and cornering forces. Fz is the vertical load on the driven axle; μ represents tyre–road friction in this model.
Fx² + Fy² ≤ (μFz)² Fx,max = √((μFz)² − Fy²)
At 60% lateral utilisation, 80% of the circle’s radius remains available longitudinally: √(1 − 0.6²) = 0.8. Cornering headroom follows a curve, not simple subtraction.
Real tyres are more complex: grip varies with slip, load, temperature, pressure and surface. The diagram aggregates the driven axle. Longitudinal load transfer can be included; lateral load transfer and individual wheel loads are not modelled.
A WORKED EXAMPLE
One half-second. A meaningful difference.
Isolate response from extra peak torque. Both examples start at 74.57 N·m and target the same 372.85 N·m stock peak. Only the illustrative time constant changes.
T(t) = Ttarget + (T0 − Ttarget)e−t/τ
A / τ = 0.45 s274.7 N·mtorque at 0.50 s
B / τ = 0.12 s368.2 N·mtorque at 0.50 s
At 0.50 s, B is delivering about 93.6 N·m more torque, although both eventually reach exactly the same peak. This isolates the response benefit; it does not claim additional peak power or a measured Ferrari response time.
Explore the algorithm, assumptions and sources +
The algorithm used on this page
For a constant target, the exponential formula above solves the first-order response exactly. Playback samples that same curve at the selected time; changing the animation speed cannot change the result.
engine_torque = selected stock or Stage 2 input
request = engine_torque  // full request in this example
torque_cap = cap_percent / 100 * engine_torque
target = min(request, torque_cap)
alpha = 1 - exp(-dt / tau)
torque = torque + alpha * (target - torque)
force_demand = torque * gear_ratio * efficiency / radius
q = lateral_utilisation
k = mu * sqrt(1 - q^2)
H = load_transfer_enabled ? cg_height / wheelbase : 0
force_limit = k * rear_static_load / (1 - k * H)
force_usable = min(force_demand, force_limit)
rear_load = rear_static_load + force_usable * H
The usable-impulse comparison integrates force from 0 to 1 second using 1 ms trapezoidal intervals. J = ∫Fusabledt and Δv = J/m. This counts the initial driving force in both examples; it is not a lap-time or acceleration-test prediction.
Solving grip and load transfer together
Set q = Fy/(μFz) and k = μ√(1 − q²). With H = h/L, rear-axle load is Fz,rear,0 + FdriveH. At the friction boundary, Fdrive = k(Fz,rear,0 + FdriveH). Rearranging gives the force limit in the algorithm. Disabling load transfer sets H to zero and recovers the fixed-load model.
Response is more than one filter
A rate limiter is different again: it bounds the permitted change per second. A pure delay holds a response back before it starts. Pedal-map gain changes the requested amount. The explorer varies a first-order time constant and a torque ceiling; it does not claim these are the only algorithms in a Ferrari ECU.
Torque inputs and model assumptions
Stock engine torque input
275 lb-ft / 372.85 N·m
Stage 2 engine torque input
315 lb-ft / 427.08 N·m
Vehicle mass
1,300 kg
Driven-axle share of static weight
60%
Combined gear ratio / efficiency
8.0 / 90%
Wheelbase / centre-of-gravity height
2.60 m / 0.45 m
Effective tyre radius / gravity
0.33 m / 9.81 m/s²
Common initial engine torque
74.57 N·m
Reference / B response constants
0.45 s / adjustable
The torque inputs come from Senica. Other constants are chosen to explain the mechanism and are not measured vehicle or ECU parameters. Peak torque is treated as a fixed operating-point input; a real engine’s torque varies with rpm, and peak torque and peak power need not occur together. μ changes both the circle radius and the lateral force when lateral utilisation is held constant; this is not a fixed-speed cornering test. The load-transfer option assumes instantaneous pitch equilibrium and omits suspension transients, anti-squat geometry and tyre load sensitivity.
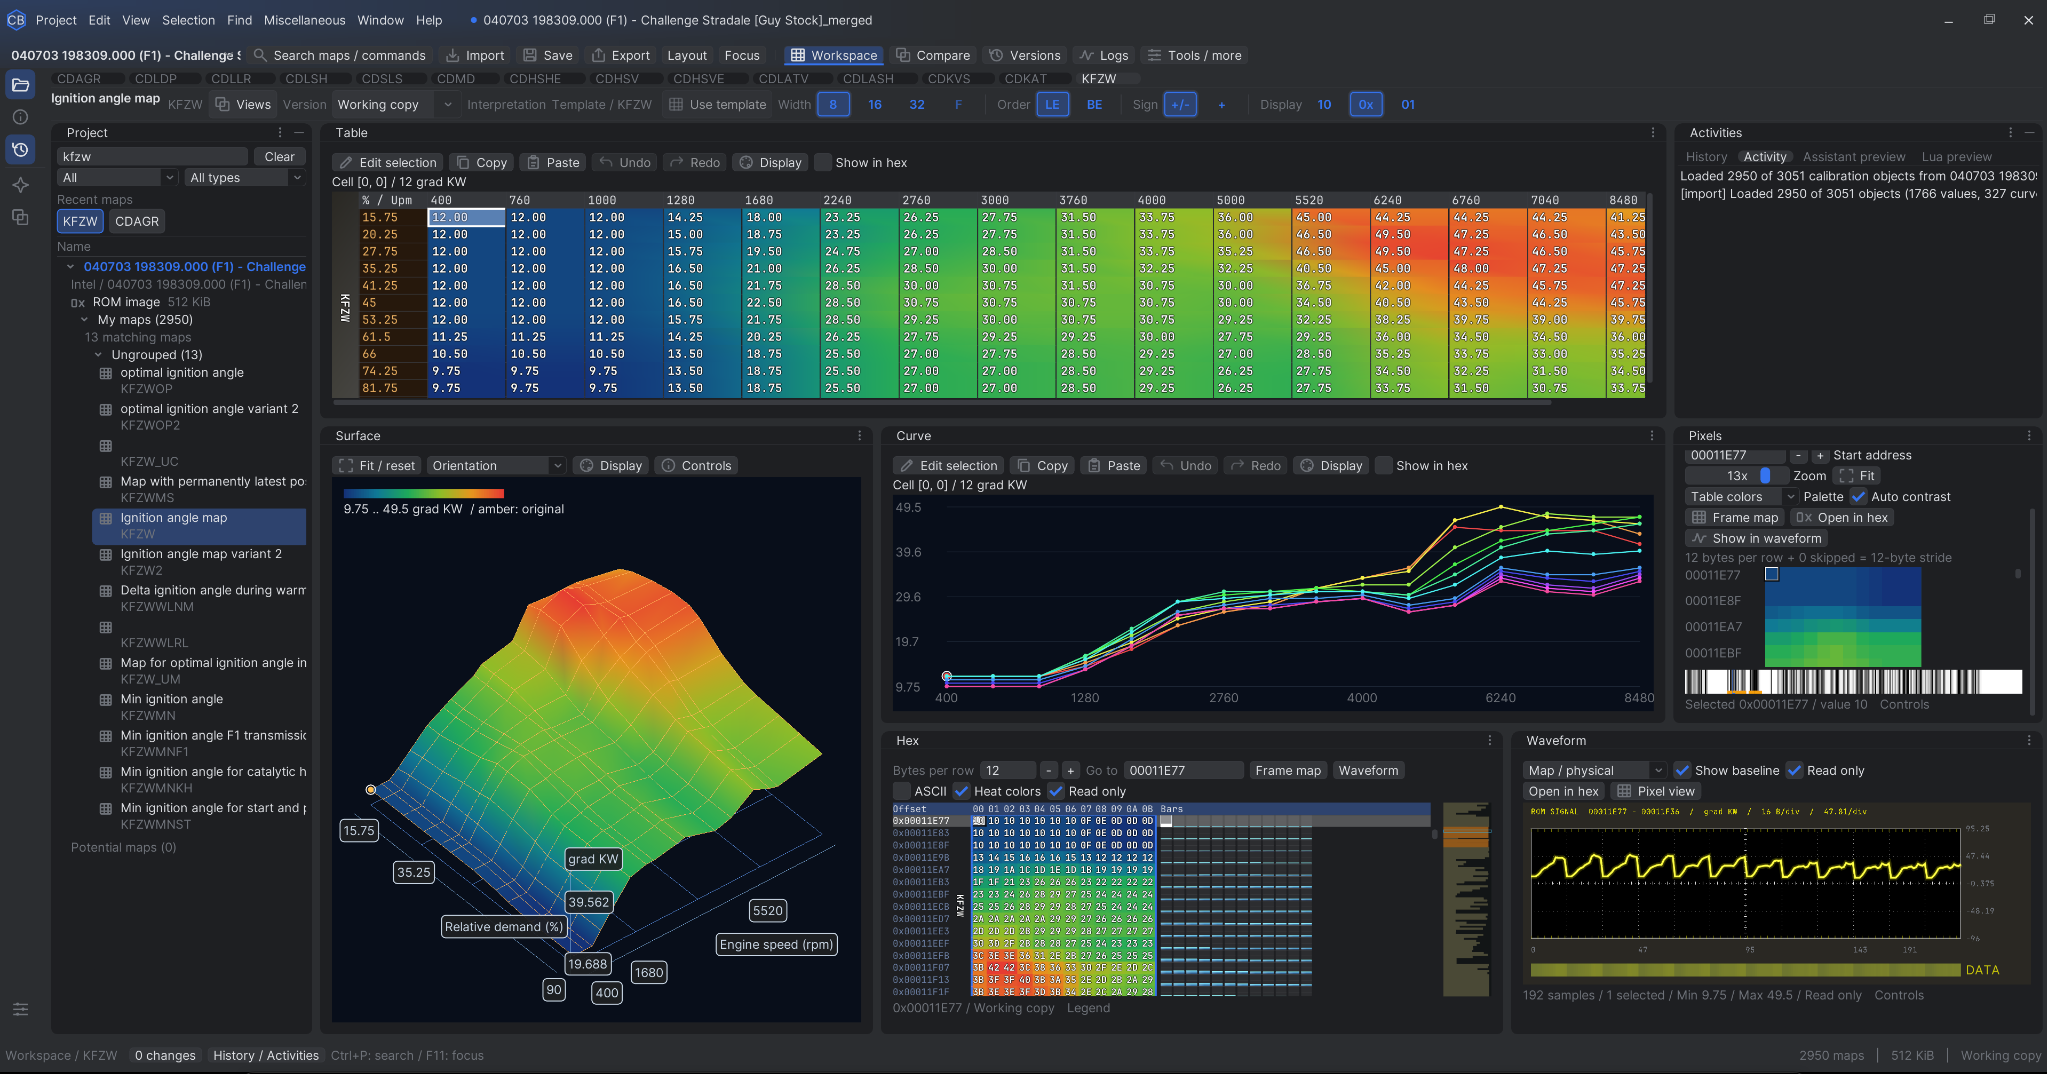
The simulator above explains principles. This is our actual calibration environment: software developed in-house to inspect maps, compare curves and work with ECU data.
The screenshot shows a Challenge Stradale ignition map. It is evidence of our calibration tools, not the source of the illustrative torque traces above.
Talk to Sam about how your car, its tyres and your intended use shape the calibration.
 THE ENGINEERING BEHIND 360TREV